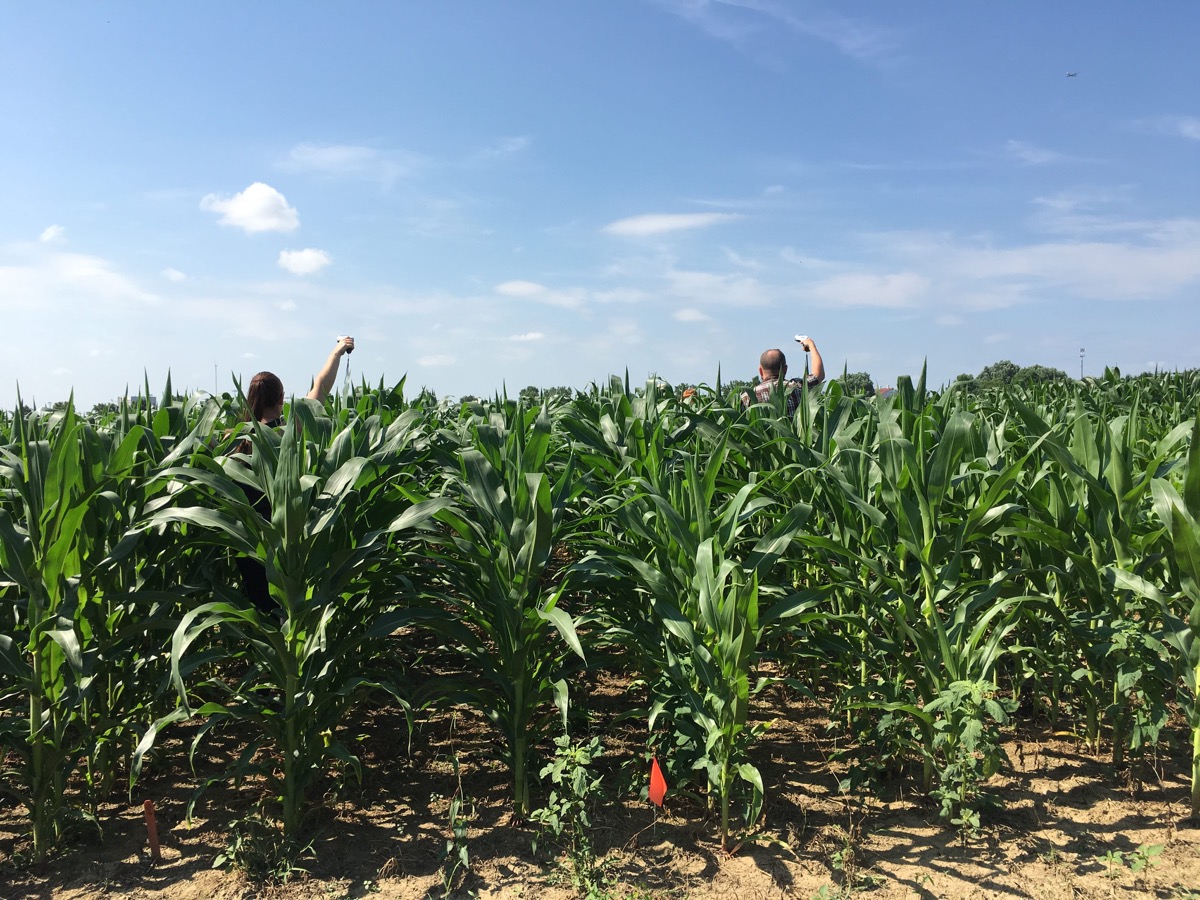
Data is helpful only if you know how to interpret it. Participants in the Tech in Ag workshop, sponsored by EducationProjects.org, the Ohio State University, and USDA’s National Institute for Food and Agriculture, gathered data and then learned how to analyze it to make agricultural management decisions.


First, participants gathered soil samples from corn fields at OSU’s Waterman Farms Agricultural and Natural Resources Laboratory and tested the pH, nitrogen, potassium, and phosphorus levels. They also used a Greenseeker handheld instrument to get NDVI readings from crops. The NDVI value is the reflectance of red and near infrared light, and it is one way to measure plant color and health. The more red light a corn plant absorbs, the healthier it is, and less nitrogen may need to be applied.
Finally, the teachers took averages of plant numbers, heights, and stem diameters in several plots that had been seeded at variable rates. All of this information was put into a spreadsheet for everyone to work with. Then the fun began!


Dr. Alex Lindsey of OSU’s Crop Ecophysiology and Agronomy department explained to the group how research trials are conducted on new products and farming practices and how those results are assessed. What makes a valid study? Treatments must be compared side-by-side in the same field and repeated multiple times. Lindsey demonstrated how to use Excel for data analysis, defining paired t-test analysis, and least significant difference. Then workshop participants, working in small groups, came up with questions to analyze using paired t-tests, which calculate the probability that the difference observed was truly due to an imposed treatment. They created graphs to represent their findings and shared them with the whole group.
Do your own field work with your students with these Growing Ohio activities!